Thursday, April 30, 2015

Copyright chief pushes Congress to adopt a radio royalty.

INSIDERADIO
April 30, 2015

The U.S. Copyright Office has pushed for a performance royalty on FM/AM airplay for more than two decades, and current register Maria Pallante is singing a familiar tune. She told the House Judiciary Committee yesterday the current lack of a radio royalty puts the U.S. out of step with the rest of the industrialized world. "It’s indefensible as a matter of law, and frankly embarrassing as a matter of policy," Pallante said. Like her predecessors, Pallante believes parity across platforms would be a fairer system to the music community and the various outlets that use their creations. "When their songs are played on radio, they’re subsidizing the profits of broadcasters," she told the panel. The House Judiciary Committee was a sympathetic venue. Its members have long pushed for a performance royalty on radio, even passing a bill to create one in 2009, only to see the rest of the House reject the idea. Rep. Jerrold Nadler (D-NY) is trying again, introducing legislation this month that would force stations to pay for airplay as well as for streaming services for recordings made prior to 1972. Nadler told his fellow lawmakers that his bill would "create a technology neutral system" that ensures artists are "fairly compensated regardless of where their music is played." Nadler’s bill has so far added just three co-sponsors, although Pallante said it provides an "excellent legislative framework."

Pallante: radio’s a royalty ‘oddity.’ Radio’s performance royalty battle is wrapped in a new package this year, as supporters have closely tied the issue to a larger update of copyright law. During yesterday’s House Judiciary Committee hearing, register of copyrights Maria Pallante said a century of regulating music it has left "oddities," like the lack of a radio royalty in place. "We have all of these disparate rates and grandfathered clauses that are really difficult to apply," she told lawmakers. "It does not serve the digital economy. It does not serve new entrants to the marketplace. And it definitely does not serve creators." Her comments reiterated a report on the music industry released by the Copyright Office last year which also advocated a performance royalty on radio. Supporters seized on her statements. The Recording Academy’s chief lobbyist Daryl Friedman said her "words were music to musicians’ ears" and they "wholeheartedly agree that music creators are struggling with outmoded laws that have not kept step with the digital age." The musicFirst Coalition also embraced her endorsement of Rep. Jerry Nadler’s proposed Fair Play Fair Pay Act, which it believes will create a music licensing system that works better for creators and radio. Meanwhile, three more lawmakers have come out against efforts to collect a performance royalty from radio stations. The list includes the House Commerce Committee’s top Democrat, Frank Pallone (D-NJ), as well as Reps. Walter Jones (R-NC) and Patrick McHenry (R-NC). That brings the number of

TV Doldrums: Key Adult Audiences Drop In C3 Research


First-quarter 2015 TV commercial ratings continue to sink this season.
 
First -quarter 18-49 prime-time audiences sank 12% among the top four broadcast networks and were down 10% among top non-kids cable networks, according to Sanford C. Bernstein & Co.’s analysis of Nielsen TV C3 research -- commercial ratings plus three days of time-shifted viewing data.
 
C3 ratings are the primary currency that TV marketers use to buy commercial TV inventory.
 
ABC and CBS had the best results during the period -- 8% and 3% higher, respectively. NBC was down 16% in the quarter, and the network had unfavorable comparisons against a year ago when it aired the Winter Olympics. Still, NBC's results were boosted this year with the airing of the Super Bowl.
 
Fox was down a massive 41% -- partly as a result of its overall prime-time doldrums, but also because of unfavorable comparisons to a year ago when it had the Super Bowl.
Other mid-to-smaller broadcast networks showed gains: CW improved 2%, Telemundo was 9% higher and Univision was up 1%.
 
Total TV C3 18-49 ratings were down 5% at the start of the TV season in September -- partially due to "Thursday Night Football” on CBS. It then went lower -- below 10% -- in December, January, and February, before improving slightly in March.
 
In the first quarter of 2015, all major cable network groups witnessed aggregate declines in C3 18-49 prime-time viewership -- with only five individual networks in the positive territory.
Among the cable groups, the worst results were at A&E Networks (down 21%); Viacom (off 20%); and NBCUniversal (sinking 17%). The better performers were Fox cable networks (slipping 3%); Disney (also losing 3%); Scripps Networks Interactive, AMC Networks, Time Warner (each losing 5%); and Discovery’s networks (giving back 6%).
 
Of the five individual cable networks that were up, three belonged to Fox, according to Todd Juenger, vice president/senior analyst of U.S. media for Sanford C. Bernstein, who co-authored the report. This included FXX, Fox Sports 1, and Fox News Channel. Other improving networks: HGTV, up 11% and CNN; 14% higher.
 
In the first quarter, kids cable channels overall were down 15% in C3 total day rating among the 2-11 demographic: Cartoon Network was 14% higher; Nick Jr., up 1%; Nickelodeon sunk 33%; and Disney XD was off 9%.

Stations On Edge Over Nielsen's New Ratings

   TVN Focus on Ratings

TVNewsCheck

April 29, 2015 8:43 AM EDT

By

Results from the ratings service’s new “code-reader” viewer measuring system that is set to replace the age-old paper diaries become available in June and what the data will look like is anybody’s guess. Uncertainty over the new system, its accuracy, its impact and its pricing appears widespread in the 14 markets where the new system is being introduced.
           
   
Will their ratings go up, down, or stay the same?
In a nutshell, that’s what broadcasters in 14 markets are anxious to find out as they await the arrival of the first sets of new data to be produced by the Nielsen “code-reader” viewer measuring system that is set to replace the age-old paper diaries.
 
The new data is almost here, due to be delivered in June to stations in the three markets where the system was first operational — Flint-Saginaw-Bay City, Mich. (DMA 70), Madison, Wis. (82) and Reno, Nev. (107) — and in July to stations in the remaining 11 markets where the system is also operational and undergoing testing.

What the data will look like is anybody’s guess. John Humphries, GM of Hearst Television's WGAL Harrisburg, Pa., an NBC affiliate, admits he’s apprehensive, but also optimistic. Harrisburg (DMA 45) is one of the 11 markets due to receive the so-called “impact data," designed to be compared with ongoing diary-based data, in July.

“Nielsen’s been measuring this market for 50 years [and] we also have done proprietary research over the years that use different samples and different methodologies,” Humphries said. “And Rentrak is in this market too. While we don’t subscribe [to Rentrak], we have seen some of those numbers.
“And every one of those independent research sources tells the same story about my station, so I would be shocked and, as you might imagine, disappointed if the new code reader methodology told a different story,” he said. “So, apprehensive, yes, but also optimistic that we’re going to retain our place in the marketplace.”
 
                  
In addition to Harrisburg, the other second-wave markets are Grand Rapids-Kalamazoo-Battle Creek, Mich. (DMA 40); Fresno-Visalia, Calif. (54); Albany-Schenectady-Troy, N.Y. (58); Mobile, Ala.-Pensacola (Fort Walton), Fla. (59); Tucson (Sierra Vista), Ariz. (71); Paducah, Ky.-Cape Girardeau, Mo. (81); Charleston, S.C. (95); Traverse City-Cadillac, Mich. (118); Yakima-Pasco-Richland-Kennewick, Wash. (DMA 122); and Santa Barbara-Santa Maria-San Luis Obispo, Calif. (123).
Uncertainty over the new system, its accuracy and its impact appears widespread in the markets where the new system is being introduced. "We have been slow to embrace this next step for Nielsen,” said Chuck Roth, director of business administration for Quincy Newspapers, owner of ABC affiliate WKOW Madison.

The station only recently agreed to participate in the code-reader trial, Roth said. “There have been a lot of stops and starts and we have had concerns about how they were moving forward."
However, many of Quincy's concerns were addressed at a meeting with Nielsen executives at the NAB Show in Las Vegas earlier this month. "We left that meeting cautiously optimistic," Roth said. "We felt that they might finally be at the point where their code reader system might work. We felt fairly satisfied that they had a good plan on how they were going to deal with the demographics."
But it’s the demographic aspects of the new system that have raised the most questions among broadcasters.

The new Nielsen system consists of two parts. One is a new generation of passive code readers that track viewing in Nielsen households. The boxes, which are affixed to every TV set in a household, identify shows by “listening” to the audio and then identify the broadcasting station via a Nielsen “audio watermark” embedded in the signals.

Unlike Nielsen’s people meters, the passive code readers do not know which member or members of the family are doing the viewing, so demographic data is to be collected from both local and national people meters located in the closest larger markets and combined with the passive data from the code readers.

Nielsen believes this system of collecting demographic data – the other, second part of the system that Nielsen refers to as “viewer-assignment” data – will produce household demographic profiles that will closely resemble the demographics of the code-reader homes. Nielsen also intends to use the system to replace diaries for collecting demos in its 31 set-meter markets (DMAs 26-56). In those markets today, the hard-wired set meters generate the household ratings, while the diaries produce the demos.

Broadcasters’ reactions to viewer-assignment demos range from cautious to downright disbelieving.
Some broadcasters say they’re reserving judgment until they see the test data. Without the data, “it’s really hard to tell” if the viewer-assignment method is viable or not, said Billy McDowell, VP of research for Raycom Media.

But at least one owner of small-market TV stations — Bonten Media — recently dropped Nielsen in favor of Rentrak due to concerns over pricing, accuracy and the way Nielsen proposes to collect demographic data in smaller markets.

In an interview with TVNewsCheck posted Monday, Bonten CEO Randall Bongarten called the new demo-collection method “ridiculous.”
“They have come to this recognition that the demographic data in particular is extremely unstable and so what they’re going to do for these smaller markets is they are not even going to collect demographic data,” Bongarten said of Nielsen.
 
“So basically what they're doing is assuming that whatever the position is of the station in that bigger market is the position of the station in the smaller market. You’re applying the same exact demography. That’s ridiculous. It really doesn’t apply because the demography can vary with the strength or weakness of the individual station in that market,” Bongarten said.

“We went to Rentrak and I am extremely happy with them,” he said. “It’s a much more stable number, much larger sample, and we get ratings every day. It’s really, really superior to Nielsen and it’s a lot less expensive.”
    
Broadcasters say they’re uncertain about the costs of Nielsen’s new measurement system and are bracing themselves to be charged more than they’re paying now for paper-diary measurement. One station contacted by TVNewsCheck paid $12,000 for the encoder used to participate in Nielsen’s code-reader test.

“[Nielsen has] been very quiet about [pricing],” said one local broadcaster, Tom Bier, general manager of Morgan Murphy's CBS affiliate WISC Madison.

Nielsen wouldn’t comment on how it plans to price the new service. But Matt O’Grady, Nielsen’s EVP-GM of local media, expressed confidence that the data produced by the new measurement system would produce new revenue for stations. “We need to ensure that we deliver solutions to [stations] that they can afford and that accurately represent the market and bring more dollars into the market,” O’Grady said.

Whatever the costs, broadcasters seem to be hopeful that the new system will yield better data than the old one. “Generally speaking, we are looking at this as a good step for Nielsen. There has to be a better system than what they have today,” said Quincy’s Roth.
 
“I can’t [imagine] that this [would not] be much better, much more reliable [and] much more consistent,” WISC’s Bier said. “I think it’s going to serve the industry well when we get to that point.… Here in Madison, we are happy to be among the first adopters of this system.”

The Role Of Mobile In The Omnichannel Purchase Journey

MediaPost's
Mobile Insider
The Inside Line On Mobile Marketing and Advertising


by Naghi Prasad, Thursday, April 30, 2015
 
Smartphone, tablet, connected TV, wearable device, desktop and laptop: what do these all have in common? They are all channels that make up the modern shopper’s purchase journey. Yet the biggest challenge faced by advertisers today is being able to understand the customer journey across these devices and deliver personalized content that is relevant, optimized and seamless across them all.
 
Mobile uptake, in particular, is on the rise and proving to be the strand that ties the rest of the journey together. Consider this: in 2014, global mobile traffic increased by 69 percent, and shows no sign of stopping. As consumer habits change, so the market changes with them. Research from comScore shows that in the past year, mobile commerce jumped 28 percent to $31.6 billion, outpacing desktop ecommerce growth, which grew by 13 percent to $236.9 billion.
 
We can see from these findings that while desktop ecommerce still owns the lion’s share of the market, mobile ecommerce is making swift gains to catch up. The same report from comScore shows that while mobile commerce is growing at more than twice the rate of desktop ecommerce, it accounts for 60 percent of digital retail engagement as measured by time spent -- but only 13 percent of dollars. Clearly, there’s an opportunity here to convert some of that engagement into sales.
 
With research also showing that 86 percent of global consumers use more than two channels to complete a purchase, mobile cannot be viewed in a vacuum. Today’s user journeys are multi-device and multichannel. Both desktop and mobile channels are valuable components of the customer journey that need to be addressed individually, yet as parts of a greater whole. The conversion funnel is becoming cross-device, and that is creating a disruption poised to change the landscape of online commerce as we know it. How can marketers win in this new environment?
 
For starters, they need to pay attention to the mobile monetization gap. Marketers already know they must optimize the funnel to achieve conversion yet many still haven’t even optimized their Web sites or landing pages for mobile. Similarly, many mobile ads are still un-engaging, poorly targeted and disjoined from the rest of the customer journey. Mobile ads are not desktop ads on a smaller screen. This approach results in diminished viewability, which leads to poor consumer engagement and fails to drive ROI.
 
Targeted reach is another area that needs attention. Mobile ad spend is expected to reach $40.2 billion by 2016. In order to ensure their budgets are spent well, marketers need to make sure that they understand their target customers’ patterns and how to best use the data they are able to glean. Today, there is more data being processed than ever before, largely because of the advances in data processing technologies that make it possible to do more with less. 
The fact that vast amounts of data can quickly and cost-effectively be processed opens the door for more relevant and personalized advertising.
 
The challenge for marketers is to be able to effectively tie together, the different data strands that originate from the cross-device user journeys. One of the most effective ways to do so is to glue together probabilistic and deterministic user data to derive a cross-device user graph with reach and accuracy. This enables marketers to identify and reach consumers across devices at scale. This methodology also allows for cross-channel attribution, which not only optimizes campaigns and improves ROI, but also delivers advertising that is more sophisticated, relevant and increasingly personalized to each customer.
 
As advertisers continue to navigate today’s complex mobile landscape, there will be winners and losers -- harkening back to the initial ecommerce revolution in the early 2000s. The stakes for advertisers to truly understand the omnichannel journey have never been higher -- but with the right insight and tools, neither have the opportunities. 

Study: Viewers Engage More With TV Ads Than Video Ads


A new biometric survey shows that traditional TV commercials are four times more engaging than video advertising on Facebook.
 
Boston-based Innerscope Research used biometric monitoring, eye-tracking and traditional survey methods to measure the nonconscious and conscious reactions of 390 consumers ages 18 to 34.
 
Participants were exposed to the same video advertisements across Facebook, TV and digital pre-roll on PC, tablet and smartphone.
 
Innerscope says the study was a “client commissioned” survey; it did not disclose the client. Biometric data is captured with technology to record fluctuations in heart rate, skin conductance and breathing patterns.
 
In addition, the survey says consumers have “higher visual attention” with final branding moments and brand logos on TV advertising -- which Innerscope says probably is a result of larger screen sizes -- than those viewed online as pre-roll for any device.
 
In keeping with results from biometric and eye tracking data, 47% of consumers said they immediately skip or ignore a video ad on Facebook before watching it.
 
Innerscope says 25% of consumers were more likely to say they would try or buy target brands after watching the ads on TV, compared to watching the ads on Facebook at 9%.
 
Innerscope says smaller screens are a big factor in lower video ad impact, where visual attention spent on branding moments, logos and taglines declined with screen size.
 
The best results with smaller screen video advertising come in the first moments of a digital video ad -- with emotional engagement peaking in the first three to five seconds. Innerscope says for smaller screens, “bright, bold copy more effectively communicated messages in cross-device campaigns.”
Dr. Carl Marci, co-founder/chief science officer for Innerscope Research, stated: "Our studies continue to show that consumers bring different mindsets and expectations to various media platforms.”

Will All TV Median Ages Soon Be Over 50?


Commentary


In August, 1991, when I first introduced the concept of using Nielsen data to calculate median ages for television networks, it was a vastly different media world than it is todayThere were only four broadcast networks, half as many cable networks as today, no video streaming, and the average home could only receive 33 channels.  It took a few years, particularly as new networks started emerging, for median age to start taking hold as an industry-wide measurement.
 
My friend and colleague Jack Wakshlag started using median age for WB during their industry presentations, and other networks and programmers soon followed suit.  It took several more years before Nielsen finally agreed to report it as a standard metric.
 
In my initial 1991 report, Fox’s median age was only 29, ABC’s was 37, NBC’s was 42, and CBS was the oldest at 45. There were only a dozen or so prime-time series with median ages above 50, all of them on CBS.
 
Ten years later, in 2000, there was still a relatively wide gap among the then six broadcast networks.  WB’s median age was under 30, UPN and FOX were in the mid-30s, ABC and NBC were in the low 40s, and CBS was in the low 50s. 
 
Another 10 years went by, and as younger viewers started to shift to other viewing sources, the broadcast networks aged considerably, while the gap between them narrowed.  In 2010, for the first time, ABC, CBS, and NBC all had median ages of 50 or higher, with CBS topping out at 55. FOX had aged up to 45. Only CW had an average median age under 40.
In 2015, broadcast median ages continue to rise, with CBS at 59, ABC and NBC at 54, Fox at 49, and CW at 44.  Roughly 45% of all ad-supported cable networks measured by Nielsen have median ages of 50 or higher.
 
Originally, median age was seen as basically a simpler replacement for looking at percent composition for numerous demographic segments.  While median age had real value 20 years ago in evaluating one network versus another, is that still true today?  
 
If your target audience is adults 18-49, does it matter that TruTV’s average median age is 38 and TNT’s is 50?  In a vacuum, maybe.  But when you know TNT gets more than twice as many adults 18-49, the answer is obviously no. 
 
Does it matter that AMC’s average median age is 42, when "Walking Dead" is 37, "Better Call Saul" is 42, "Mad Men" is 52, and "Turn" is 55?  Or that FX’s average median age is 41, when "American Horror Story" and "Louie" are 37, "Mike & Molly" is 50, and "Justified" and "The Americans" are 55?
 
I recently worked at ION, and one of our ongoing frustrations was that too many in the industry looked at median age as though it meant something way beyond what it actually means. It was clear that if we could only get our average median age under 50, the industry would look at us differently. 
Should it really matter, for example, that ION’s "Criminal Minds" has a median age of 53, compared to Nick-at-Nite’s "Friends" at 35 and USA’s "Modern Family" at 41?  Even if all three have pretty much the same adult 18-49 ratings and "Criminal Minds" has a significantly higher Adults 25-54 rating?  Of course it shouldn’t matter. 
 
Unfortunately, in our business perception often trumps reality. And 50 is still a magic number.

Sunday, April 26, 2015

What’s Behind Modern Rock’s Growth.

INSIDERADIO
April 26, 2015                                        


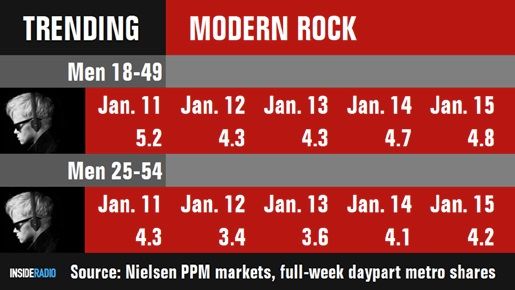
Modern rock continues to enjoy steady ratings growth, thanks to a deepening well of young, melodic bands and investments made by broadcasters to strengthen their brands. The format’s ratings share of men 18-49 grew 12% during the past three years while men 25-54 increased by double that amount, Nielsen data shows.
 
Modern rock added an outlet in Phoenix last year and moved back to a full signal in Chicago, while HD Radio-fed translator stations sprouted up from Tampa to Raleigh to Minneapolis.
 
“What we’re seeing is the influence of today’s Millennials on musical trends and musical tastes,” says Jim Fox, OM of Entercom’s Sacramento cluster and program director of modern rock “Radio 94-7” KKDO. The generational shift from Gen X’s “Hey, wait, I’ve got a new complaint” to Gen Y’s “Shut up and dance with me” has jacked up the format’s pop quotient during the past three years and spawned cume-enhancing crossovers.

“The core sound is focused, fresh and strong,” says programming strategist Greg Strassell. “Crossovers help expose the genre, making some alternative music true mass-appeal hits and giving it added cume appeal.”

The pendulum shift to pop has also heightened sharing with adult alternative. Half of the 10 most played modern rock songs this week are also top 10 at adult alternative, according to Mediabase.
But sharing music makes it more challenging for modern rock to have a unique musical position and enjoy the perks of “owning” artists. “It comes down to whether you are willing to fight for those songs in an environment when you could have 5-6 other stations playing them,” Fox says.
Modern rock wouldn’t be in a strong position today without a steady stream of quality music. But there's more to it than that. Many companies have improved their brands. “Morning show development, and some re-branding and refocusing of station names to rid themselves of rock images that may have held them back, has helped stimulate consistent growth,” Strassell says.

A strong music cycle is a good time to ensure other brand elements are being developed, he says. “Otherwise that music tide could go out and leave you with only the strength of what is between the music,” Strassell says. “Now is the time alternative should be building great morning shows and other brand features.”

Programmers also need to keep their antenna up for the next musical shift. “If the alternative radio community doesn’t recognize when that pendulum of critical mass begins to swing in the other direction, they’ll get let behind,” warns Fox.

Today’s emphasis on pop has some programmers wondering what happened to the electric guitar in modern rock. Troy Hanson, head of corporate programming for rock formats at Cumulus Media, chalks it up to some modern rock PDs having closed minds. “You hear them complain about playing too many crossovers and not having artist ownership anymore. But that’s the danger of poo-pooing any type of rock song because it ‘sounds like an active rock song,’” Hanson says. “The audience doesn’t talk like that.”

TV Set Viewing Drops While Device Viewing Rises


by , April 21, 2015, 3:55 PM

TV may not be going away, but the TV set itself is on the decline. Slowly but surely, TV viewing is rising on other devices and dipping on TV sets, according to a new study from global research firm Accenture.
 
Consumers are increasingly watching TV programming on smartphones, tablets, mobile devices, and laptops. Meanwhile, TV screen usage saw a double digit decline in the past year.

Specifically, viewership of movies and TV shows on TV screens dropped 13% worldwide and 11% in the United States in the last year, the study said. Even that TV stalwart, sports programming, took a hit. Sports viewing on TV screens fell 10% worldwide last year and 9% in the United States. The study was conducted last fall with 24,000 consumers in 24 countries.

The rate of change is most pronounced among young consumers. The study found that viewers age 14 to 17 had moved away from TV sets for viewing of movies and TV shows at a 33% decline. Viewership among those 18 to 34 fell 14%. For those 35 to 54, the drop was 11% last year.

Accenture said that consumers are viewing TV shows and movies on all kinds of mobile devices because of improvements in streaming video quality as well as longer battery life of mobile devices, the study found. However, some consumers say that online video streaming is still not of the highest quality, underscoring the need for continued tech advancements in this area.

Amidst all these changes, one constant remains: consumers still like to watch video content. A separate study from Emarketer found that U.S. adults will spend about 5 hours and 31 minutes watching video content on TV and digital devices each day this year. Consumption of video on digital devices alone will average about 1 hour and 16 minutes per day, compared with only 21 minutes per day in 2011.

Suddenly, TV spending looks stronger

Medialife

Boost in scatter spending lifts TV out of recent doldrums
 
By Bill Cromwell
April 21, 2015

 
TV spending Retail ad spending surged to end the quarter.

Maybe the upfront won’t be quite as lackluster as buyers and analysts are forecasting.
A 46 percent surge in scatter spending during March boosted TV ad spending in first quarter.
If that demand continues, buyers may be more inclined to lock in pricing during the upfront, when most of the ad time for the coming season is sold, rather than risk paying more for ads bought in the scatter market, when the remainder of the time is auctioned off.

According to Standard Media Index, which tracks ad spending for 80 percent of U.S. agencies, first quarter broadcast spending rose 7 percent year over year, when removing dollars from last year’s Winter Olympics.

It found cable too was up versus last year, growing 4 percent when removing Winter Games spending.

“A nice uptick in scatter dollars fueled national TV growth in March, which is certainly a good sign for the health of the ad marketplace,” says Scott Grunther, executive vice president of media at SMI.
A rebound for retail, one of the biggest spending categories for television, helped fuel the growth for TV ad spending.

Retail spending grew 17 percent in March, following declines in January and February.
Retailers cut back after struggling to lure shoppers into stores during the terrible weather that plagued the East Coast during the start of the year.

But in March, those shoppers came back. Consumer spending was up 0.9 percent in March,
Overall, ad spending rose 1 percent in first quarter, SMI says, with TV capturing 46 percent of that spending.

Digital spending surged by 23 percent, more than any other medium, with social networking sites up 41 percent and video sites such as YouTube and Hulu up 38 percent.

As usual, traditional media struggled. Though out of home was up 1 percent in first quarter, print and radio saw declines.
Radio was down only 1 percent, but newspapers dropped 2 percent and magazines were off the most, 7 percent.

Those categories were hurt in part by the slowdown in first quarter auto advertising. Auto decreased by 3 percent, though buyers say some of that may be because dollars are being moved into cheaper media, such as digital.

The fastest-growing advertising categories in first quarter were consumer electronics and business services and recruitment, which both rose 17 percent.

Only A Matter Of Time Before Netflix Takes Advertising?

MediaPost's
TV Watch
Full Frontal Television


A media critique by Wayne Friedman Tuesday, April 21, 2015
Sharply divided opinions are focused on Netflix’s future. Some believe the company will continue to soar; others believe it’s a disaster waiting to meet its media maker. In that regard, one veteran media agency buying executive, speaking with TV Watch, asked an incredible question: “When will Netflix start taking TV advertising?”

Though Netflix CEO Reed Hastings swore that will never happen, some analysts believe the wild spending for TV-movie content by the company — a projected $5 billion for programming in 2016— means Netflix will have to answer to the financial media gods one day.

That $5 billion will be more than HBO, Showtime, Amazon, and Starz spent on programming in 2014 -- combined.

The positive news that could keep Netflix out of clutches of TV-video marketers? One analyst estimates the company could grow by triple in five years to an eye-popping 180 million worldwide customers.

With its reasonable price point of $8.99 a month, you can see why some consumers can’t turn down a run with Netflix. Netflix has over 62 million global subscribers and over 40 million in the U.S.

And cord-cutters? Worried entertainment consumers are an easy target, those who are spending $90 to $125 a month and need financially to make a change.

Analysts like to make comparisons to that one big pay TV player:  HBO. That similarity isn’t correct. Consumers are using Netflix as an TV service “anchor” as a partial replacement for slimming down on big cable TV channel packages.Netflix has the added benefit of allowing viewers to blow through a year-long 13-episode series in a weekend.

But that added pressure to ramp up production in wildly accelerated ways, bolstering Netflix’s original TV and movie slate, has caused concern. So, Netflix will need to find a way to keep that very modest $8.99/month price tag around for consumers. And advertising might be an answer.
Some history here: AMC — the network of “Walking Dead” and “Mad Men” — started off as a cable channel with no advertising. It just ran old movies.

Then over time it gradually added “sponsorship”-like advertising opportunities, messaging that would appear before and after programming. Now we are left with a network with traditional TV advertising/commercials.

PBS programming has consistently added sponsorship/advertising messaging — including video — before and after TV programming content.

So could Netflix nudge into a marketplace with some kind of digital “pre-roll” advertising, stuff digital video consumers are now used to? Better still, could Netflix also offer up the option to viewers to skip the pre-roll ad after five seconds?

More than other new digital platforms, Netflix has the added burden of dealing with a massive misstep of just few years ago, when it wanted to raise prices by separating its now DVD by mail business from its new and fast growing streaming video service.

Netflix will continue to walk the line with customers. But if it will never consider adding some revenue-producing advertising, how will its business model evolve?

Tuesday, April 21, 2015

Enforcement Bureau looks at new weapons to go after pirates.


INSIDERADIO
April 20, 2015

 
New FCC Enforcement Bureau chief Travis LeBlanc is known as a tough cookie, a hard-nosed prosecutor who has brought big cases against large corporations. One area where he plans to flex his muscle is on eradicating pirate radio, believing that an ounce of prevention is worth a pound of cure. The problem with pirate radio enforcement right now, according to LeBlanc, is it has become a "wack-a-mole" scenario. Shut them down here and they pop up over there. Case in point: LeBlanc’s office last week issued a $20,000 fine against a New York pirate who, over the last three years, received several notices of unauthorized operation. Yet he kept showing up somewhere else. "I’m looking at the effectiveness of our enforcement," LeBlanc told broadcasters at the NAB Show. He said he intends to go beyond traditional enforcement means like Notices of Apparent Liability, forfeitures, citations and seizures. "Having a regime that solely relies on that will not ultimately be as effective," LeBlanc said. "I am thinking about how we can prevent pirates from getting on the air." LeBlanc believes the Bureau needs to implement the type of policy that is decisive and effective. He told broadcasters that he’s in discussions with the National Association of Broadcasters, his own bureau and the chiefs of other bureaus about policy options "that remove the incentives for pirates to go on air." He said he plans to work with broadcasters on the issue. "We want to get to a world where there are no pirates on the airwaves," LeBlanc said.

In a slow quarter, first read shows radio outperformed TV and print in local markets. The radio industry’s official report on first quarter won’t be released by the Radio Advertising Bureau for several weeks, but the just-released Standard Media Index estimates total radio revenue slipped 1% during the first three months of the year. One reason may be automotive advertising, which SMI says "remains soft" in the early going of 2015. Across all media it says auto category ad spending was down 3% compared to last year. On the flipside, business services and recruitment advertising was the fastest-growing segment, up 17%. Television and print were both weaker than radio: TV billings dropped 6% and newspapers were down 2% in first quarter. Out of home was the local market winner, although its revenues rose by a mere 1%. Overall ad market spending rose by 1% for the quarter year-over-year. Several radio managers have said revenue has been swinging between up 1% and down 1% so far this year. SMI data seems to reflect that on a wider scale. Its snapshot is based on data that captures 80% of total U.S. ad agency spending.

Traditional Television Viewing Continues To Grow


Commentary

by , Yesterday, 9:15 AM 


The headline of this article is not really accurate, but many will just see the headline, so I’m getting a lot of people to get the message I want them to get. It’s still more accurate than many of the articles and columns proclaiming the decline of television viewing that always surface right before (and during) the upfront buyng/selling season.
 
I’ve had many debates with my editor friends at both print and online outlets about their responsibility reporting dubious research claims as “fact.” 

But this is really only marginally a press problem.  As long as they have a credible source, and present the data sourced and quoted, they’re off the hook -- regarding the content of the story at least.  Working under daily deadlines, they have neither the time nor the resources to vet every claim.
They simply report what people say. I would not want the editors of MediaPost to question every research-based claim I make.  If someone has a problem with it, let them say so in the comments section, or write their own article. 
 
I do think, however, that reporters who have been covering this business for years shouldn’t pretend they know nothing about these topics.  When they do use some of these mediocre or agenda-based research studies, they should at least quote a more objective source within the same story (I, and several other research executives I know, would gladly offer our services in this regard).
Several years ago, my colleague, Sharianne Brill and I were co-chairs of the Council For Research Excellence’s Media Consumption and Engagement Committee. 

Along with some of the best research minds in the business (buyers, sellers, and advertisers) we helped develop the landmark Video Consumer Mapping Study
 
There were two tidbits that came out of this study that did not receive much press.  First, when asked about their media behavior, people dramatically overstate their online usage and understate their TV usage.
 
I recall after the study we asked the participants about their media behavior.  One person was asked how much time she spends on her smartphone. She thought it was at least two to three hours a day.  It was actually about 20 minutes.  And this was someone who knew we had just observed her actual media usage. People simply have no real idea about how much time per day they spend using different media devices.
 
The second point, which came as a surprise to me, was that Nielsen data for broad usage levels (total people, adults 18-49) was remarkably similar to the results of the observational data. This started to change as the demo groups got smaller, but for the broad categories it was spot on. 
 
I only bring this up because when it comes to determining whether TV viewing is shifting, I much prefer to rely on Nielsen data and its Total Audience Report than studies done by companies that benefit from people thinking TV viewing is declining, while alternate sources are growing unabated.
 
In reality, television viewing is down by 3% from last year, while video viewing on Internet, smartphone, and multimedia devices combined is up by 45%.  Misleading statistics considering their vastly different starting points. A more telling statistic is that 91% of all video viewing is still to traditional TV (and more than 90% of that is live viewing).
 
Even among the under-25 crowd, more than 80% of viewing is still to traditional television.
Another way to look at it is that viewers spend nearly 5 ½ hours per day watching television, compared to about 25 minutes per day watching video on the Internet and smartphones combined.
 
Television viewing, while not immune to the many other sources available to consumers, is still dominant and quite healthy thank you.
 
What’s the bottom line here?  When seeing headlines proclaiming or predicting the downfall of traditional television, read the entire article and note the source.

Senators Seek To Block Comcast's Merger With Time Warner


by @wendyndavis, 6 hours ago

Comcast's proposed $45.2 billion takeover of Time Warner Cable would result in “higher prices, fewer choices, and poorer quality services,” a coalition of senators says in a letter to the Federal Communications Commission and Department of Justice.
The lawmakers are asking regulators to block the deal, arguing that it would leave Comcast with too much power over broadband and other forms of communication.

“With 57 percent of the broadband Internet market and 30 percent of the cable market, Comcast-TWC would have an ability to defeat competing TV and Internet companies and stifle American innovation across the industry,” states the letter, sent today and signed by Sens. Al Franken (D-Minn), Bernard Sanders (I-Vt.), Ed Markey (D-Mass.), Ron Wyden (D-Ore.), Elizabeth Warren (D-Mass.), and Richard Blumenthal (D-Conn.).

They add that Comcast's ownership of NBCUniversal gives the company “incentives and means by which to extract higher prices from other multichannel video programming distributors and prioritize its own programming over that of competitors.”

Comcast says that the deal will result in better video and broadband for consumers. The company says its broadband connections are 25% faster than Time Warner's, and that it has twice as much video on demand as Time Warner.
\
The company also says that the deal won't reduce competition, given that the two companies don't currently overlap. Comcast also says that the deal will only leave it with 30 million of the 87 million U.S. broadband subscriptions.

The lawmakers estimate that Comcast will control 57% of U.S. broadband connections is based on the FCC's new definition of broadband as Internet speeds of at least 25 Mbps. Comcast's numbers come from a report by the Leichtman Research Group, which looked at broadband subscribers in the U.S. at the end of last year, before the FCC revised the definition upward.

The letter from Capitol Hill comes just days after reports surfaced that staff at the Justice Department are leaning toward opposing the merger. Comcast reportedly is slated to meet this week with officials from the DOJ, in hopes of salvaging the merger.

One concern raised by opponents of the deal is that Comcast could use its broadband footprint to harm online video companies. Writing this week in Medium, broadband policy expert Susan Crawford says that the deal would provide Comcast with “innumerable opportunities to squeeze online companies.”

She adds: “Every element of the Comcast network provides an opportunity for control and rent-seeking... Comcast can use data caps and other pricing mechanisms to make life miserable for online businesses that aren’t willing to play along.”

Comcast currently imposes data caps in some markets, starting at 300 GB per month, with each additional 50 GB costing an extra $10.

Thursday, April 16, 2015

Smith reaffirms radio’s role in NAB keynote


INSIDERADIO
4/14-16/2015
 
Gordon Smith used the occasion of his fifth anniversary as president of the National Association of Broadcasters to declare broadcast radio and television "more important today than they have ever been," despite a cavalcade of technology changes that have occurred since he first spoke at the NAB Show in 2010. "While citizens may be feeling bombarded by so much information and confused about how to distill it — confused about finding the truth — broadcasting is giving our communities coherence," Smith said during a convention-opening keynote Monday in Las Vegas. He called broadcast radio and television "the glue that keeps us together." But broadcasters need to keep reminding policymakers of broadcasting’s "immense value to their communities," Smith warned. For radio, the message includes ensuring new royalty rates "will fairly compensate artists while encouraging more radio stations to stream" and fighting back renewed efforts in Congress to enact performance royalty legislation. Smith’s message came on the same day a bill was introduced in Congress during a high-profile media event in New York, where co-sponsors were surrounded by Elvis Costello, Roseanne Cash, Cyndi Lauper and dozens of other musicians. Smith also spoke about working towards "common-sense ownership rules that reflect today’s media landscape." He talked up NextRadio, which NAB Labs played a key role in, calling it part of "radio’s exciting evolution," and pledged further support. He predicted as some digital platforms "come and go like so many endangered species — but broadcasting will always be there, when all else fails" and pointed to this year’s NAB Show as "a tangible demonstration of how broadcasters are innovating."

 
Nielsen ready to launch streaming audio measurement service. Radio’s long and winding road to total audience measurement is nearly over. After a seven-month delay, Nielsen is about to reveal its digital audience measurement service. "The official launch is coming very soon," Nielsen SVP of digital Jeff Wender said at the NAB Show yesterday. "The technology is there and we have the infrastructure in place." Along with providing a more complete picture of a station’s audience, the new product will track on demand audio, podcasting and other forms of digital audio content produced by Nielsen clients. The system employs the same MRC-accredited methodology Nielsen has been using to measure online video consumption. Clients place measurement software in the media player of their streaming app or web browser, which captures listening data at the closest point to the actual consumption. Four basic metrics will be included in the streaming audience reports: Reach (number of listeners, sessions and quarter hours); Demographics (gender and age by daypart), Duration (Time Spent Listening) and Location (metro or DMA). Several of the largest streaming backbone providers, including Triton Digital and Wide Orbit, have integrated the software into the media players used by thousands of radio stations. A number of broadcasters are receiving preview data. "We built this new software so we get the best understanding of who is consuming the content," Wender said. "We can capture all the juicy


Under the hood of Nielsen’s new digital audio measurement service. Nielsen’s new streaming audio measurement service will provide an alternative to Triton Digital’s Webcast Metrics, which has long served as the industry scorecard. Nielsen’s new product will provide more demographic data than Triton, without relying on clients to collect the data themselves. It instead will tap technology widely used in the digital display and video advertising worlds. When a user launches a stream, Nielsen measurement software is automatically activated and begins collecting the necessary info: the station’s unique identifier, the length of the listening session and timestamps. It also detects an ID number unique to each listener, a technology first developed by Apple and Google for mobile advertising. That ID or key is sent to Facebook, which has a partnership with Nielsen and stores the same keys for its own user base. Facebook then matches the audience keys against its database and reports back to Nielsen the demographics of the streaming audience in aggregate form so individual users can’t be identified. To provide checks and balances, Nielsen will incorporate proprietary data from an internal calibration panel. After a lack of industry consensus about how digital audio data should be reported in the Mediaocean and Strata buying systems used by agencies, Nielsen has now clarified how it will differentiate between the different ad models used by webcasters. For streams that simulcast the same content and ads as their on-air broadcast, Nielsen will report their digital and on air listening – both separately and combined. Audience metrics for stations doing digital ad insertion won’t be combined and will be displayed in a separate tab. "Depending on the different type of advertising system that you put in place, we’ll measure both and make that information available," Nielsen SVP of digital Jeff Wender said.

Study: Radio prevails in connected car.
 
AM/FM radio remains the primary entertainment option in the car, where roughly half of all radio listening takes place, while connected sources like internet radio are secondary. So says new data from Strategy Analytics presented at the NAB Show. Eight in ten (79%) survey respondents called broadcast radio a "must have" in their car, far and away the top entertainment product of eight measured. Interest in having a CD player is "falling off rapidly"............
 
 
.........the new report says, in favor of music consumed on iPods and smartphones. While radio still rules the road, 58% of U.S. smartphone owners report using apps while driving and there is a growing desire for connected cars that make it easier to use them on the road. Nearly four in ten (37%) consider access to smartphones apps through the vehicle’s interface a "must have" feature for their next car. More entertainment options aren’t turning listeners away from broadcast radio, the data shows. For instance, 79% of consumers who listen to CD players and 76% that listen to internet radio in the car also listen daily to AM/FM radio. "The very users who want smartphone access in the car are the biggest radio users," Lanctot said. The study also uncovered a strong appetite for local information services in the car. Seven in ten daily radio users said they are very interested in real time traffic available through their car’s infotainment system, while 65% want info.

Colorado Gets All-Pot Station. Southern Colorado Radio has launched "K-High 1580." It’s the first station whose programming is dedicated to marijuana around the clock. SCR has struck a three-year lease deal with an option to buy Pilgrim Communications’ KHIG, which had been "Fox Sports Radio 1580" prior to Monday’s switch. Most broadcasters have shied away from taking medical marijuana dispensary advertising to date, fearing their federally-licensed stations could be in jeopardy. But SCR general manager Mike Knar tells the Colorado Springs Gazette that he’s signed on six local dispensaries as advertisers and billings are growing faster than expected. "Most people don’t get a response like this on radio, let alone for an AM station," he says. KHIG’s morning drive is called "Wake and Bake" followed by "High Noon" in middays and "High Drive" in afternoon drive.


SPECIAL EDITION: EXPANDED NAB SHOW COVERAGE ABOVE


When Will TV Upfront Money Start Flowing To Other Times Of The Year?

MediaPost's
TV Watch
Full Frontal Television


A media critique by Wayne Friedman Wednesday, April 15, 2015
Many upfront connoisseurs are already saying traditional TV upfronts will probably show a flat to decreasing dollar volume.
 
But don’t think for a minute those exact dollars will find their way to digital video coffers. Executives do believe traditional video dollars will  be moving -- at some point. Digital video advertising piece will come to $7.7 billion in 2015, according to eMarketer.
 
Supply and demand issues are still a problem with the big TV networks, especially when it comes to their ability to scale up big quantities of viewers. But looking at the NewFronts as an alternative may be folly. Instead, look for ongoing deals made through the year -- in the traditional/digital TV scatter market; calendar year TV deals; or longer branded entertainment TV/digital deals. Some call that a success.
 
For over a decade many have predicted the upfront selling process would go away.  Now we have TV marketers increasingly holding on to their ad  dollars to spend them not only in the traditional TV scatter markets, but with new digital TV services throughout the year.
Consider future TV upfronts like a 30-year-old home roof -- one with slow drips.

TV Viewership Declines Across All Demos


Traditional viewership for long-form video content, such as movies and television on a TV screen, has declined over the past year -- and not just with young viewers.
 
In a new survey, Accenture says there was a 13% drop worldwide and an 11% decline in the United States. Even looking at live TV viewing -- specifically at sports programming -- there have been cutbacks in usages on the traditional TV screen, 10% globally and 9% in the U.S.
 
Virtually all age brackets witnessed declines worldwide. Those 55 and older have seen a 6% cutback for movie/TV show content on the big screen and a 1% drop in sports programming. That said, younger viewers -- 14- to-17-year-olds -- have seen a steeper declines, down 33% for movies/TV shows worldwide and 26% for sports TV content.
 
Eighteen- to-34-year-old viewers have pulled back 14% for movies/TV and 12% for sports programming; those 35-to-54 gave up movies/TV by 11% and for sports, 9%.
 
Accenture says 89% of consumers watch long-form video on connected devices. But this isn’t entirely good news. More than half -- 51% -- say watching online video was a poor experience due to Internet services. Some 42% complained of too much advertising and 33% about buffering of video -- the time it takes for video to start playing. Thirty-three percent said there was a loss of sound or distortions during play.
 
New TV service entrants will not necessarily have an advantage over traditional TV players.
“New entrants, regardless of their brand, will have to prove their service quality to consumers to capture significant market share,” stated Gavin Mann, Accenture’s global broadcast industry lead. Accenture says new TV brands, like Apple, Netflix and Google, scored significantly lower than traditional broadcasters.
 
Accenture says research was conducted online in October and November 2014, with 24,000 consumers in 24 countries.
 
Dr. Philip Jay LeNoble of Executive Decision Systems Inc. of Littleton, Colorado noticed the research did indicate that while demographics moved away from traditional screens, TV was still watched on alternative connected devices albeit the there were problems with the transmission.

Tuesday, April 7, 2015

The outlook for spot TV: Slow growth


  Media economy

The next few years will bring minimal gains in local TV spending

By Bill Cromwell
April 7, 2015   
2016 olympics spot TV One bright spot: The 2016 Summer Olympics will lift spot revenues but those gains will be offset by declines elsewhere.

Over the next three years, the U.S. media economy will grow at an average rate of at least 3.6 percent per year, according to the latest forecast from ZenithOptimedia, a Publicis Groupe agency.

But one area that will see much slower growth is spot television.

Spot has only just rebounded from the depths of the recession, when spending plummeted as local and national businesses pulled back on their commitments.

ZenithOptimedia is predicting modest growth for the medium over the next three years. This year will be up 1.5 percent, next year will rise 3 percent, and in 2017 spending will be flat.
By comparison, total media economy spending is forecast to rise 3.7 percent this year, 4.1 percent next year, and 3.6 percent in 2017.

“In 2015, local television dollars will see a slight uptick, although at a less robust growth rate without political spending in the marketplace,” notes the report.

Even with the biannual gains from political and Olympics, spot suffered mightily during the recession, with $5 billion lost from 2007 to 2009. Last year was the first time since 2007 that spending topped $23.6 billion, hitting $24.4 billion.

By 2017, ZenithOptimedia predicts, it will grow to an all-time high of $25.5 billion.

The spot TV forecast

Political will be the key to most of the gains over the next three years, of course.
ZenithOptimedia says the robust growth of political action committees, third parties that spend in support of candidates or ballot initiatives, could lead to some political dollars being spent in fourth quarter of this year, in anticipation of the 2016 elections.

That will give the end of 2015 a lift.
And analysts do expect record political spending on next year’s presidential election, with spot TV accounting for the biggest chunk.

Plus, Summer Olympics in 2016 will also bring in money to spot TV.

But those gains will be offset by more modest increases for the top spot TV spending categories, such as retail and automotive.

Both have started this year slowly, with retail suffering from a funk that began last year with sales down for many of the major department and discount stores.

They’ve been pulling back on advertising across a range of media in response to that slowdown, including spot.

Auto, meanwhile, has been experimenting more and more with local search and social media, which buyers say has cut into spot budgets for some dealers.

According to Dr. Philip Jay LeNoble CEO Executive Decision Systems, Inc. of Littleton Colorado, "The only real way to visualize revenue growth and increased net profitability in local television is to employ management to concentrate in enhancing the training, development and sustaining of long-term, local-direct contract dollars." "There are little or no other options," he adds. 

U.S. TV Ad Expenditures

2010-2017
$ Millions at Current Prices
 
2010
2011
2012
2013
2014
2015
2016
2017
Spot TV
20,134
20,134
22,550
23,227
24,388
24,754
25,496
25,496
Total TV
56,525
58,029
62,547
64,348
67,004
66,865
68,153
68,393
Source: ZenithOptimedia