Monday, July 25, 2022

TV Upfront Marketplace Posts 'Modest' Gains For 2022-23 -- 5.8% To $20.1B


TV Upfront Marketplace Posts 'Modest' Gains For 2022-23 -- 5.8% To $20.1B

TV upfront marketplace, including broadcast and cable TV networks, posted “modest” gains -- up 5.8% to $20.1 billion, according to estimates from Media Dynamics.

While broadcast and cable networks grew similarly in volume -- up 6.4% (to $9.9 billion) and 5.2% (to $10.2 billion), respectively -- broadcast  showed strength when it comes to prime-time 30-second commercials in terms of the cost-per-thousand (CPM) viewers.

Broadcast grew 9.6% to $47.14, while cable TV networks rose 6.6% to $23.30.

“[There was] a definite softness in cable sales relative to broadcast, as many buyers felt that they were better off diverting fairly large sums to streaming venues -- despite their higher CPMs -- as a hedge against future scatter market pricing for broadcast prime,” says Ed Papazian, president of Media Dynamics.

Overall, he adds, these gains "were well below last year's spectacular hikes due to buyer concerns about the looming threat of an economic recession."

A year ago, big broadcast TV networks in the upfront market for the 2021-2022 season took in an average 19% gain in prime-time broadcast CPMs, and 10% higher for cable TV networks, according to Media Dynamics.

This year is different. He says: “Linear TV sellers were willing to trade off smaller CPM increases for their linear TV platforms in exchange for increases—often at higher CPMs—for their streaming services.”

Shoppers Spent More in Q2, Possibly Due to Inflation


Shoppers Spent More in Q2, Possibly Due to Inflation

Supply-chain problems and fears about inflation are not preventing consumers from spending online.

Average order value increased by 19% in Q2 compared to Q1, according to an analysis by customer platform Klaviyo. 

Yet brands are offering 18% fewer discounts as they cope with increased prices for goods. 

Meanwhile, small businesses that sent “Back in Stock” emails saw a 9% increase in order value compared to the prior quarter.

Klaviyo defines “small” as firms with less than $5 million in revenue. 

The sheer number of orders increased in several categories, compared to Q1:

  • Apparel & accessories — 13%
  • Food and Beverage — 12%
  • Jewelry — 4% 

In contrast, health and beauty orders increased by only 2%, and the average order value by 1%. And consumers placed 5% fewer electronics orders. 

In addition, consumers placed only 2% more orders for home goods in Q2, with the average order value rising by 7%, probably due to inflation.

The average order value is up 24% in the U.S., compared to 9% in EMEA and 2% in APAC. 

“Despite the economic headwinds, consumer spending in certain categories continues to be consistent, particularly in categories like apparel and accessories as consumers start attending more events and returning to the office,” concludes Andrew Bialecki, CEO and co-founder of Klaviyo.  

Bialecki adds: “While consumers might pare back on buying higher priced goods like electronics, or price shop for more ‘essential’ goods, they’re still going to buy from the brands they love.”

Klaviyo examined results from over 300 million global shoppers across more than 80 countries and territories powered by the company’s platform.

Marketing Signals the End of Times -- Or Maybe It's Just Pubic Hair


COMMENTARY

Marketing Signals The End Of Times -- Or Maybe It's Just Pubic Hair

According to some, we are in the last throws of the Western democratic industrial model. Plagues, crumbling economies, migration, inequality of access to food, shelter, income and healthcare, as well as climate change, are all indicators of the beginning of the end, say doomsday believers.

Some people like to add that the end must be near, because we are living in a decadent society which is losing touch with its morals and basic believes. And I am almost ready to believe them when I take the following, totally subjective and self-observed occurrences, into consideration.

First proof point: since going off cable, and full-time on streaming, my family is now being held hostage by the power of poorly functioning ad serving algorithms. During the live evening news, watched via the app of our local news station, we sometimes get served the same Chevy Equinox or Chevy Truck Month ad seven times, back-to-back. In three or more consecutive breaks. I do not know if Chevy has tested this tactic as successful, but I hate Chevy for it, along with its media agency and my local news station. This is what you get from a crappy programmatic algorithm, a lazy agency and station, and a non-capped reach and frequency incentivized media plan. It demonstrates a pure lack of media plan management morals.

Second proof point: ads on TV for stuff I did not know needed ads on TV for. Or needed mentioning at all. There is Pete Davidson selling a product called “Manscape." It is a shaver you are supposed to use for all your body hair. Everywhere.

At the same time, P&G is singing the praises of pubic hair in a catchy tune for Gillette, wanting to “unshame” the having of body hair. I think we can agree the end of times are near if we both promote the having of, and the not having of bodily hair, in TV ads, in one ad break.

Third proof point: spending money on celebrities and then giving them splashy marketing titles, as if the sponsorship deal really is some kind of employment agreement. The latest I saw reported on Bloomberg: “Kate Moss has been appointed creative director of Diet Coke as the brand celebrates its 40th year. The catwalk star, 48, will partner with some of the world's leading fashion houses as part of a new campaign to promote the drink using the slogan "Love What You Love."

To use a British description: what a load of bollocks. What really happened here is “we paid Kate Moss to appear in our ads and some of our events." Diet Coke is trying to pretend something that isn’t what it is. Surely another sign, right?

Marketers continue to feel overwhelmed. Mediapost reported on that this week: “Marketers are overwhelmed by their workloads. For one thing, they have far too many sources to wade through to get the information they need, according to Marketing Trends Report, a study from Airtable.” And they continue to be fired and replaced faster than you can say “integrated marketing strategy”.

I hope that the examples mentioned here are merely a proof point of stressed-out marketing leaders who got lost wading through far too many sources for data and insights, and that it is not the beginning of the end of marketing and Western Civilization as we know it.

And that is a positive, right?

Tuesday, July 19, 2022

Strong Correlation Between TV Viewers' Attention, Marketers' Brand Gains: Survey


Strong Correlation Between TV Viewers' Attention, Marketers' Brand Gains: Survey

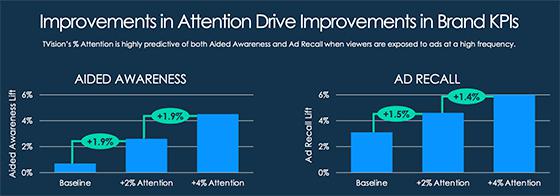
There is a direct “one to one” correlation between TV commercials' "attention" score and marketers' all-important "brand lift" measure, according to a survey from TVision, a TV measurement company and Upwave, an advertising-tech brand-measurement company.


“We found proof of strong correlations,” said the companies, “between the percent of attention... and lift in aided awareness and ad recall,” TVision measures second-by-second, person-level data about how people watch TV using “eyes on the screen” technology.

"Aided awareness'" is the percentage of respondents aware of a marketer's product, brand, or advertising when asked.

For example, if a campaign reaches 100 million people, which gets a 38% score in “attention” -- instead of 34% -- that means an extra 4 million people recognizing one's brand.

Digging deeper, the research also notes that “attention” can vary greatly between high and low placements depending on daypart, network, and program. For example, programming can show a 43% difference, while networks can show a difference of 23%: and dayparts, 9%.

TVision and Upwave research comes from linear regression analysis of more than 40 national campaigns between the fourth quarter of 2019 and the first quarter of 2022.

Campaigns from ad categories include those in finance, consumer packaged goods, fast food, automotive, retail, telecommunications, and pharmaceutical.

When U.S. Economy Gets Rough, Moms Still Spend


COMMENTARY

When U.S. Economy Gets Rough, Moms Still Spend

In 1992, Bill Clinton was elected President. The media was quick to attribute the success of his campaign to capturing the votes of “Soccer Moms.” 

It was the first time the media had focused on women with children as a collective powerhouse of voters, consumers and decision makers. Never before had so much media attention shined on moms until 2022 -- the year of formula shortages, angry school board meetings and professional women who hold positions as first responders and educators.

As someone who has written about the power of moms since 1999, I’d like to say the attention they’re garnering today is a long time coming.  It’s unfortunate that it took a pandemic, formula recall, $5/gallon gas and rising prices at the grocery store to do it.

Nonetheless, as a marketer, congratulations to the brands who have decided to put their advertising dollars focused on tapping into the $3.1 trillion moms spend collectively in the U.S. economy each year. 

I’m not accusing brands of ignoring moms as purchasers. I believe that companies such as Proctor & Gamble, Kimberly Clark and Kellogg’s have long known that moms are their main target as buyers.

However recently I’ve seen traditional television ads focused on marketing to moms by the likes of Bank of America, Swarovski, Carhartt, and Google.   I can’t help believing that recent headlines highlighting the innovative ways moms are coming together to source formula or moms developing less expensive solutions to every day consumables have contributed to the awakening of marketing departments across Fortune 500 global brands toward moms as consumers.

If your company is still sitting on the sideline trying to figure out how to better tap into the buying power of moms, here’s a few tips.

Start by listening to your customer. It’s so easy to do this in today’s world of social media.  Search hashtags related to your product and find out what moms are saying about you and your competitors. Resist the urge to jump into the social conversation with comments, likes or shares until you clearly understand the mom's point of view.

Establish a long-term relationship with mom consumers. Executing a one-off campaign won’t work. Moms want to have a relationship with the brands, products and companies they do business with. This can be following them on social or serving as an ambassador in their local market.

Create content that’s relevant and timely. Sending a back-to-school coupon is great, but sending it out in September misses the target. Moms begin preparing for back to school in July, because most schools south of the Mason Dixon line return to the classroom in August.  Unfortunately agencies and media based in New York City recognize back to school as the day after Labor Day, when their local students return to the classroom.  Point is, good content delivered at the right time is a great way to establish a relationship with moms.

Use influencers wisely. Seek out mom influencers with high engagement rather than large numbers of followers. The power of word-of-mouth marketing among moms is their interactions with each other. Don’t be fooled by influencers or agencies that sell you on impressions.  If no one is listening, it doesn’t matter how many moms on their feed.

As consumers begin to tighten their spending, it’s a good time to target moms, who control America’s household spending.

Local OTT Advertising To Hit $2B, Doubling 2020 Total


Local OTT Advertising To Hit $2B, Doubling 2020 Total

Local over-the-top (OTT) TV advertising is estimated to sharply climb to $2 billion in revenues by the end of this year -- up from $1 billion in 2020, according to a new study.

The research comes from BIA Advisory Services, a local media consultancy, and is sponsored by Vevo, the digital music video network.

The authors say the average compounded annual growth rate (CAGR) over the past two years for OTT was 43% -- which makes it the fastest-growing local media.

After local TV OTT comes local digital radio, with an annual growth rate of 24.3% over the last two years, followed by local mobile at 20.8%, local digital magazines at 17% and local PC/laptop advertising at 16.6%

The top advertising local OTT category for 2022 is projected to be general services, at $337.2 million. This includes legal/law firm businesses, as well as plumbers, HVAC contractors, utilities, and funeral home operators, to name a few.

The second-biggest local OTT category is automotive, at $273.2 million, followed by restaurants ($203.4 million); health ($202.8 million); and finance/insurance ($182.8 million).

Looking at six U.S. regions, the biggest growth was in Mid-Atlantic markets, with 53% CAGR, and the lowest was the Pacific Southwest, 39% Other regions were as follows: Northeast (47%), Southeast (40%); Midwest (42%) and Pacific

The Expansion Is Over: Ad Economy Recedes For First Time In 16 Months


The Expansion Is Over: Ad Economy Recedes For First Time In 16 Months

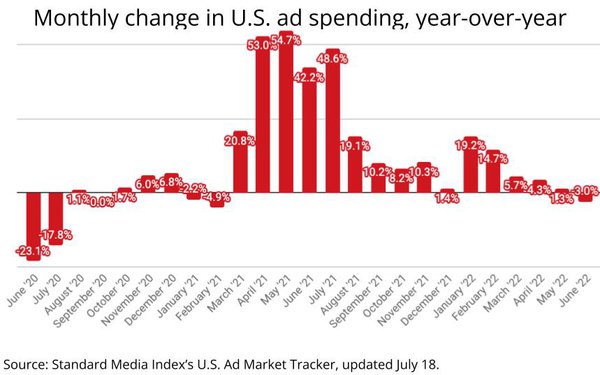
The U.S. ad market contracted 3% in June, marking the first decline since February 2021, according to a MediaPost analysis of data from Standard Media Index's U.S. Ad Market Tracker.

The contraction follows a steady deceleration of the U.S. ad market's expansion coming out of the COVID-19-related advertising recession.

Relative to June 2020, which fell 23.1%, June 2022's ad market index actually expanded 36.6%.

Most of the June 2022 contraction was due to reductions by the nation’s largest advertising categories. Spending by the top 10 categories fell 5.2% in June, while all other categories actually expanded 1.2%.

Most of June’s erosion occurred among traditional media spending.

Among media, the erosion was mostly among traditional media, which contracted 16.6% from June 2021, while digital expanded 8.6%.

Digital’s share of all media spending rose to six points to 62% in June