Saturday, June 5, 2021

Millennials Most Likely To Spend Big On Travel, Per TripAdvisor, Accenture

 TRAVEL

Millennials Most Likely To Spend Big On Travel, Per TripAdvisor, Accenture

·       by Tanya Gazdik , Yesterday

While confidence to travel appears to be returning among all age groups, it is high-income millennials who are most likely to spend big on travel this year, per a joint study by Tripadvisor and Accenture.

The study was fielded before the latest mask guidance issued late last week by the Centers For Disease Control, which could help the category if it results in consumers feeling more comfortable in engaging in pre-pandemic activities like travel.

"The Future of Travel," executed by Qualtricson on March 3, interviewed 1,000 respondents from 49 states, evenly distributed across Gen Z, Gen X, millennial and baby boomers. 

The findings are encouraging for brands because among those planning to spend more than $5,000 on their next trip, as many as 62% have not yet made a booking. For brands, the opportunity is there to attract the purchasing power of this audience now, per the results.

Of those U.S. respondents who did not take a trip at all in 2020, nearly two thirds (61%) said they are comfortable doing so in 2021. Respondents earning $100,000 or more are leading the way in likelihood to travel in 2021, with over a third (34%) having already booked a trip for 2021, compared to less than one in five (19%) of the remaining population.

Those who traveled in 2020 are more likely to have booked a 2021 trip already. Of those respondents that traveled last year, 41% have already booked 2021 travel compared to just 13% of those who did not travel at all in 2020.

U.S. travelers are getting more adventurous in their plans, especially in the higher income brackets. Over half (54%) of all U.S. respondents earning more than $50,000 are considering domestic air travel for their next trip, while 25% of those earning $100,000 or more are considering flying abroad for their next trip.

Millennials earning above $50,000 are the most eager to fly. Three out of five (58%) of those surveyed are considering domestic air (compared to 41% among other age groups) and 25% are considering international air travel (that’s 1.8 times higher than the average among respondents in other demographic groups).

Respondents who have already booked a trip are five times more likely to be taking an international trip as opposed to a staycation (a trip less than three hours from home).

Travelers are planning longer trips this year — 87% of respondents who have already booked travel have opted for a trip of three nights or more. Of those yet to book a trip, 77% are also planning a break of three nights or more. 

Luxury vacations are the order of the day. More than a third (37%) of high-income Mmllennials are planning to spend more than $5,000 on an upcoming luxury trip.

Elsewhere, MediaRadar released an analysis of tourism ad spend, including trends from hotels and regional tourism efforts, like Visit California.

The platform analyzed ad spend across print, national television, and digital formats between January and April 2021.

In the weeks leading up to National Tourism Week (May 3-9, 2021), regional tourism ad campaigns spent $67.7 million across print, national television, and digital formats. This is up 136% month-over-month when comparing March 2021 ($28.7m) to April 2021 ($67.7m).

When comparing year-over-year (YoY), April 2021 saw a 130% increase from $29.4 million in 2020 to $67.7 million this year.

The largest campaigns came from Visit California, Las Vegas Convention and Visitors Authority, Visit Maryland, Visit Myrtle Beach South Carolina, and Visit Florida. Collectively, their spend accounts for $9.5 million 15% of total spend in the category.

Hyper-local campaigns from California far outpaced any other regional campaigns in the month of April 2021. San Diego, Lake Tahoe, Laguna Beach, Long Beach, Big Bear and the Central Coast all appear in the top 15 spending advertisers over the past four weeks.

Spend in the hotel and hospitality industry increased 8% from March 2021 to April 2021, with $44.7mm invested across print, television, and digital formats. Luxury hotel groups are contributing to the resurgence of this industry as consumers are more likely to travel as pandemic restrictions are lifted.

Airbnb and VRBO continue to maintain a strong presence in the hospitality market. Ad spend from both of these companies account for 26% of all ad spent in the month of April 2021, per the research.

Friday, June 4, 2021

Audience-Based Buying Is Taking Over -- How Advertisers Can Successfully Adapt


Audience-Based Buying Is Taking Over -- How Advertisers Can Successfully Adapt
“The only thing that is constant is change.” That adage rang true in ancient Greece, when it was originally stated by philosopher Heraclitus, and today it rings truer than ever for the TV advertising industry.

According to a recent survey of over 200 marketers, 89% of marketers say they are expecting a “significant shift” away from traditional demographic-based TV buying to an audience-based buying (ABB) strategy over the next three years.

So, if you are an advertiser, how do you prepare for this future? The first step is to know what exactly audience-based buying is.

What is audience-based buying?

With advances in technology and measurement, marketers can target and buy multiscreen TV ad campaigns based on specific audiences such as lifestyle characteristics and purchase behavior.

Using anonymized aggregated data to inform their decision-making, marketers can deliver relevant advertising directly to custom audience segments like “new parents” or “in-market car shoppers,” wherever and whenever they are watching.

The bottom-line impact: By thinking beyond traditional demos, and opening up buying to all audiences, marketers can better engage their most likely current — and future — customers and unlock access to consumers who spend nearly $4 trillion annually, or 41% of total U.S. spending, based on data from the US Bureau of Labor's 2019 Consumer Expenditure Survey

Furthermore, audience-based TV-buying opportunities are growing, as marketers have a variety of platforms to choose from.

Many major media companies have introduced their own solutions, such as NBCU's NBCUniversal One Platform and Ampersand's The AND Platform, while consortiums like Project OAR and OpenAP are collaborating with companies like AMC, Fox, ViacomCBS, Univision, FreeWheel and Vizio to overcome issues with standardization and simplify the buying process overall.

Amid this shifting TV advertising landscape, in which technology, measurement and opportunities are all evolving, there are tangible steps that advertisers can take to set themselves up for success for the rest of this year and beyond. Below is an outline of three of those steps.

Examine the strength of your organization's training and tools on audience-based buying

While many marketers understand some aspects of what audience-based buying is, only 33% of marketers recently surveyed identified the precise definition.

In addition, over half of all marketers (55%) said they have either been trained informally by peers or have not received any training at all.

This indicates a real need for more education of planning and buying teams. To give your organization an advantage, consider whether there is an opportunity to introduce new training practices, tools and resources to ensure teams are learning how to best implement change.

For agencies, taking action such as developing an in-house training program or building out a data-management practice can be instrumental in educating internal teams and ultimately facilitating data-driven TV buying.

Prepare for the future by testing and learning what works for your brand and build upon those insights in future campaigns

To a large degree, marketers are implementing some form of audience-based buying. Only 8% of marketers are not currently employing an audience-based approach.

Furthermore, 33% of advertisers say ABB is a key part of their buying strategies, and the rest say it is a small part of their strategy or they are still in a testing phase. The fact that most marketers are employing ABB in some form means they are proactively preparing themselves by investing in data and analytics capabilities and building out their targeting and measurement capabilities, as well as testing and learning.

Many advertisers recognize that now is the time to assess which platforms, targets and tactics work best to deliver business outcomes.

This “test and learn” mindset will help brands achieve success in the future as the industry increasingly moves toward a total audience-buying approach. Rome wasn't built in a day, and neither does an ABB strategy have to be.

Employ an audience-first buying strategy to achieve a variety of business KPIs

One of the benefits of an audience buy is the ability to precisely target and measure beyond traditional media metrics and look at business outcomes. Data shows that marketers believe strongly in the ability of ABB to drive business outcomes.

Notably, they believe those outcomes to be full-funnel.

Looking to drive awareness and reach? Consider that 74% of marketers believe ABB can deliver incremental reach of key consumer groups. Looking to build brand love? Seventy-two percent of marketers believe it will add deeper engagement. Looking to grow sales? Sixty-two percent of marketers say audience-based buying can increase sales.

The TV advertising landscape is at an inflection point — as the practice of audience-based buying is bound to continue growing.

Today, there are actionable steps that marketers can take to strengthen their ABB strategies, and those that take these steps will set themselves up for success for the years ahead.

Not Just OTT Ad Dollars, TV Stations Want Higher FCC-Regulated Carriage Fees


Not Just OTT Ad Dollars, TV Stations Want Higher FCC-Regulated Carriage Fees

Gray Television, a major TV station group, wants new OTT streaming platforms that carry local TV stations -- and will in the future -- to pay the same rate that cable, satellite, telco, and virtual pay TV providers do.

It has filed a document with the FCC asking it to consider OTT platforms as traditional MVPDs. That means they have to negotiate "retransmission consent" with individual stations. This includes Hulu, YouTube TV, Roku, Amazon Fire TV, among others.

And you know what this really hints at: Larger carriage fees -- the ones TV stations are desperately need to show big-time financial growth.

In an FCC document, a former FCC commissioner, now Gray lawyer, said ABC, CBS, Fox and NBC negotiates current OTT agreements and then offers them to stations at rates "far lower than the stations receive for traditional MVPD retransmission consent,” according to report in Broadcasting & Cable.

Right now, Roku, Amazon Fire TV, Samsung TV Plus and others aren’t FCC regulated. So guess what? They can essentially pay what they like — or not.

This goes hand-in-hand with TV stations that complain Facebook isn’t paying much to TV stations for linking news content to TV station websites. By making these new streaming/OTT MVPD regulated, TV stations can be assured of big revenues to come.

The backdrop: Traditional pay TV providers keep losing ground in the traditional MVPD world. Cord-cutting subscriber declines now regularly hit 7% per year. That means less money to TV stations.

At present, things aren’t down. But they aren’t spiking, either. S&P Global says retransmission fees inched up 2% to $12.17 billion in 2020 from $11.89 billion.

We know local TV stations are continuing to pursue other businesses -- OTT ad sales platforms selling locally/regionally based streamers, direct digital media ad revenue, and possibly, digital media competitive businesses, coming from the new ATSC 3.0 standard.

High-profile TV business news content is all about streaming -- not an area TV stations want to miss. With OTT ad sales platform units, TV station see ways to leverage their linear, local TV viewing with new streaming viewers, virtually all younger than traditional TV viewers, who are around 60.

Of course, the longer-term question is: Should TV stations get what they want, will those younger viewers find content on TV stations they want, via those streaming app platforms? And if it isn't local TV news content, what then?

Designing And Marketing With Accessibility In Mindby


Designing And Marketing With Accessibility In Mind

We’ve read/talked/learned a lot about smart devices -- how they can help you gain control and confidence via self-monitoring your health and wellness, how they can provide proactive support for lifestyle changes, how they enable you to live an untethered, on-the-go life (not so super-useful this past year, though), etc.

But that utility, and that ability to start tracking your workout or pick up a call from your Apple Watch, is predicated on the assumption you can easily tap the watch screen and navigate the device with your fingers. For many people with disabilities, this is simply impossible. Now how is that device providing any sense of “smart” to someone who can’t access and unlock (literally and physically) its critical features to enhance and improve life?

As part of its previews of software updates designed for people with disabilities, Apple recently shared that it’s seeking to rectify the way its devices were traditionally designed. By noting that “accessibility is a human right,” Apple’s improved design approach seeks to provide better accessibility for people with disabilities ranging from mobility, vision, hearing, and cognitive.

Among the updates was my personal favorite, AssistiveTouch, a motion-controlled feature (based on Apple Watch’s built-in gyroscope, accelerometer, and heart rate sensor-based data) empowering those with limb differences a way to navigate Apple Watch without having to touch the controls or display, unlocking true utility and value.

Designing with accessibility in mind is a critical, yet often overlooked conversation. We design for targets, for reach, for platforms, but we don’t always design for accessibility.  This challenge isn’t reserved solely for technology, either.

When it comes to inclusivity, it can’t just be about your marketing. Everything, from the product to the packaging and advertising -- inadvertently or purposefully -- highlights your stance on inclusivity and how you deliver it.

For example, Degree Deodorant sought to address the challenges of typical deodorants may pose for those with visual impairment and upper limb motor disabilities with Degree Inclusive, a complete remake of Degree’s standard offering. For example, the cap has a hook to be hung up while the rest of the package can be pulled down, a magnetic cap closure to make putting the cap back on easier, grips built into the packaging to make it easier to hold, a larger application to minimize how many swipes you need, and a Braille label on the packaging to make it easier to find and identity your deodorant.

The recent celebration of Global Accessibility Awareness Day reminds us that design for all requires the input, feedback, and insight from all, for all. This speaks to the power your product, and your packaging has, to convey a message, and how important your design can be when impacting someone’s everyday life.

Whether or not you have control over your brand’s product or service, the marketing strategy -- from what is shared to how it’s shared -- needs to include the lens of accessibility. Whether that means bringing in advocates, tech specialists, and/or other stakeholders that understand and live with disabilities, recognizing and embracing the power of design to push the boundaries of how you previously saw your products and strategies is critical to delivering true utility for all.

It's Time to Unite Brand And Response Advertising


It's Time to Unite Brand And Response Advertising

A curious thing happened this spring. Airbnb, in its May earnings call, announced it had recently slashed its global sales and marketing budget by 28% -- mostly in performance advertising -- and concurrently launched its first brand campaign in a half decade. Not only did Airbnb web traffic remain steady, but it grew consumer response in the five countries exposed to its TV brand advertising.

Why would Airbnb, in a post-pandemic recovery where millions hanker to travel again, downplay performance marketing for branding? Because direct response and brand advertising is converging.

Think of this merger as a new model, precision branding, that closes the age-old, counterproductive divide in marketing planning.

Marketers are in the business of memory management, and direct response and branding each pull only two of four psychological levers that build memory: primacy, recency, frequency, and story. We tend to remember the first incident of any kind (e.g., the first person we ever kissed), what happened in the past day or week, people or things we encounter frequently, and incidents that resonate with our inner narratives. Whether it’s getting your first job or a fight in high school, we remember moments that informed paths we see ourselves taking in life.

Direct marketers’ focus on primacy and recency works but doesn’t inspire long-term loyalty. Sending 20 retargeted ads every time someone visits your site is easily replicated. But the Interactive Advertising Bureau finds consumers respond to online offers principally for free shipping, coupons, free product trials and discounts -- hardly a way to build repeat sales.

Brand marketers’ focus on storyand frequency strikes emotional chords consistentlyThe Dove “Real Beauty” campaign told the common story of women who don’t perceive themselves as beautiful. The Nike brand is conceptually valued at $30 billion because “Just Do It” resonates inside every athlete. These brand stories are the Story of You -- and are more likely to create long-term customer relationships.

Precision branding brings all aspects of memory-building together, by connecting the best of direct-response offers and recent messaging to the larger canvas of story over time. Brand can drive response, and studies by Accenture have found effective brand levels often provide a 22% or higher lift in immediate response funnel performance; direct response in turn has data sources that can be connected to high-impact storytelling.

So next time you enter your advertising budgeting cycle, try designing a campaign in which data informs all aspects of paid media. Explore how data can be connected to “brand media.” Run forecasts in which brand lifts direct response, and DR-type data in turn boosts brand performance. Above the line and below the line are now fallacies, because that line is gone.

The results may surprise you. As Airbnb’s CEO Brian Chesky noted, advertising can focus on education, instead of just being a tool “to buy customers.

Average U.S. Viewer Now Uses Nearly 6 Different TV Sources


Average U.S. Viewer Now Uses Nearly 6 Different TV Sources

While some consumers are consolidating their streaming services, as of now, U.S. consumers are using more TV “sources” than ever, according to the latest annual Best Bundle study from Hub Entertainment Research. 

The average U.S. TV viewer now uses 5.7 TV sources, defined as inclusive of traditional pay-TV services (cable, satellite, telco), virtual MVPDs, individual SVODs, individual AVODs, antenna TV and transactional services. 

The number has jumped by nearly one full service since just last year, when it was at 4.8. And it’s nearly doubled since 2018, when it was 3.0. (In 2019, it was 3.7.)

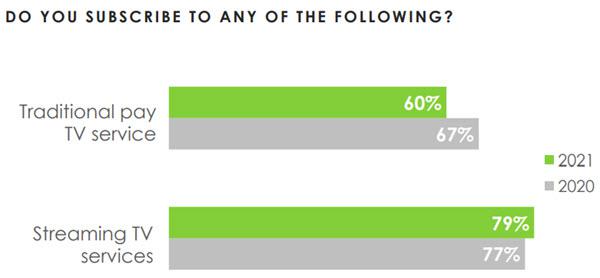
The study — conducted among 1,600 U.S. consumers ages 16-74 who watch a minimum of one hour of TV per week — also finds 79% of TV consumers now using at least one streaming service. 

That’s up only 2 points from the early pandemic days of 2020, when last year’s survey was conducted. But it’s fully 19 points higher than the percentage of those using a traditional pay-TV service (60%). And the pay-TV user percentage is 7 points lower than it was in 2020.


Further, the number who report using three or more of the top five paid streaming services (Netflix, Amazon Prime Video, Hulu, Disney+ and HBO Max) has leapt significantly since last year’s survey: from 28% to 40%, while the number using none of these has declined by 2 points. (HBO Max wasn't yet launched when the 2020 survey was taken.)

Overall, the number using two or more of the top SVODs has risen 8 points, to 59%. 

Another reason for the jump in the number of sources: The percentage using a free, ad-supported TV service is also up 8 points since last year, to 48%.

But using an array of sources isn’t necessarily a highly satisfying experience: 52% of all TV consumers say their current combination meets their needs “very well,” 42% “somewhat well” and 6% “not well at all.”

The “very well” percentage does rise along with the number of sources used, but even at eight-plus sources, it only reaches 63%.

What's Right - And Wrong - With AVODs


What's Right - And Wrong - With AVODs

Ad-supported streaming services, aka AVODs or FASTs, are the darlings of the media world now, with good reason.

Their strengths — along with some weaknesses on the advertising front — are documented in a new report from Verizon Media and Publicis, “Capitalizing on the CTV Opportunity.” The report is based on a nationally representative survey of 3,000-plus U.S. TV viewers, fielded between Feb. 1-11.

The results underscore the reasons for growing adoption of ad-supported services.

While 71% of respondents described paid/premium SVOD as their current “go to” service, 48% said they worry about the costs and are sharing log-in credentials to save money.

Respondents reported using five streaming services, on average, with 75% saying that no one streaming service “has it all,” and 45% saying they feel they’re using too many services to get the content they want.

At the same time, 61% agree that they’re more aware of AVOD offerings than they were a few years ago, and half say they’re interested in ad-supported streaming services.

Nearly three-fifths say they'd prefer it if more streaming services offered cheaper, ad-supported subscription tiers, and 83% using paid ad-free streaming services say they’re willing to try an ad-supported version of paid services to save money.

More than three-quarters (77%) report already seeing ads across cable, live or AVOD services; 66% report seeing ads on AVOD services of any kind (free or paid); and seven in 10 say that paid, ad-supported streaming services are worth the price.

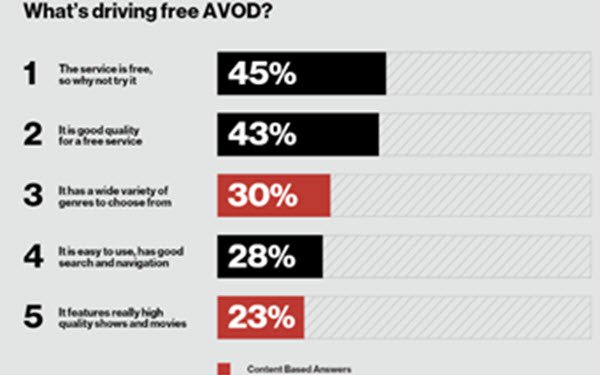
Forty-three percent say that free ad-supported services offer “good quality"; 30% agree that they offer a wide variety of genres from which to choose; 28% say they’re easy to use and have good search and navigation; and 23% say they feature “really high-quality” shows and movies.

The “but”: 39% of AVOD subscribers have considered ad-free alternatives.

Digging more deeply, the survey found many ad-supported service users frustrated and annoyed with the advertising experience.

Sixty percent cite overly long ad breaks as an annoyance, and the same percentage say there are too many ad breaks.

Nearly as many (58%) complain about seeing the same ad repeatedly during the same show or consecutive shows they’re watching.

And 53% say commercials that occur in the middle of the action of a show, in a moment that’s not a natural break in the action, are “the worst.” Which may explain why 54% of those who have both AVOD and cable say that cable ads are less frustrating.

Possible fodder for solutions for creating a better ad experience: 54% say a countdown clock indicating how much time is left in an ad break would help; 67% that they would prefer just one or two ad breaks during programming; and 62% that putting breaks only at the beginning and end of a program would be optimal.

In addition, 53% say they would prefer ads that are more relevant to them.