Deregulation May Come for Local TV, But Who Will Benefit?
Proponents of broadcast TV deregulation say it will be a win for local journalism, but radio offers a cautionary tale for localism’s prospects.
Who benefits? That query is posed in detective stories spanning authors from Agatha Christie to Scott Turow and beyond. It’s also what I asked myself when I saw the news about bipartisan members of Congress petitioning the FCC to revisit the current ownership rules for broadcast media.
My question is fueled by two different thoughts. The first is that the current executive branch of the U.S. government is the most transactional U.S. administration I’ve ever seen. The president prides himself on his ability to make deals. He expects the same focus, along with absolute loyalty, from all who report to him.
FCC Chairman Brendan Carr gets the message. Among his first actions upon assuming the chairmanship was to reinstate bias complaints about coverage of the Trump campaign: ABC, for its handling of the debate between Donald Trump and Kamala Harris; CBS, questioning the editing of the 60 Minutes interview of Harris; and NBC, which had Harris appear on Saturday Night Live immediately before Election Day.
The second thing driving my question is that the letter sent to Chairman Carr says the reforms requested will allow broadcasters to, among other things, “promote local journalism.” Is that true?
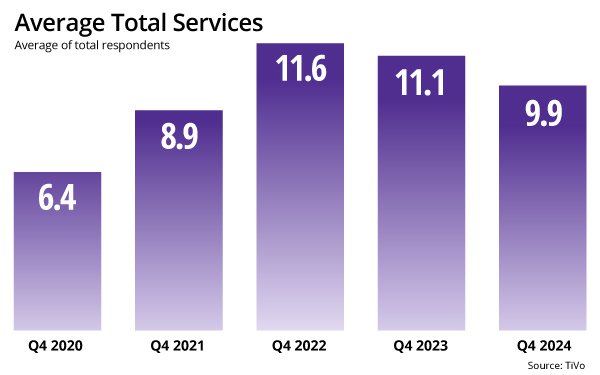
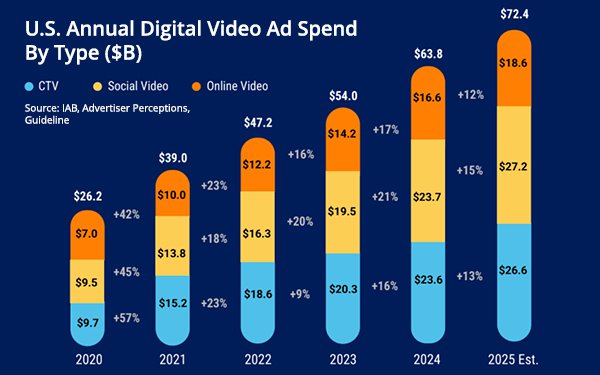
There is no doubt that the broadcasting business is suffering. Advertising dollars are shifting to digital outlets. Research continues to show declines in linear television viewership. Appointment viewing seems to be limited to sports and, among older audiences, news.
To make matters worse, sports programming continues to move to non-broadcast outlets. The NFL, for example, now offers game packages to its own streaming network (NFL Channel) and to a number of other video outlets in addition to the game packages it sold to three broadcast networks. Further, there’s the possibility that the league can exit its broadcast deals as early as 2029.
Broadcast, beginning with radio in the 1920s, was envisioned as a local medium. Unlike the approach in other countries, it was set up as a private local business that would sell advertising, while investing in equipment, personnel and content. In the Communications Act of 1934, Congress established what became the FCC. Its charter was to license frequencies and have license owners commit to regulations. These have variously included requirements for programs that help local audiences understand community issues (localism); rules for children’s programming; how to deploy and test the Emergency Alert System; closed captioning; prohibitions against airing indecent content; a requirement to present controversial issues and to fairly reflect varying viewpoints (fairness doctrine) along with other rules and regulations. (Understanding Broadcast and Cable Finance – A Primer for Non-Financial Managers, 2nd Edition, while dated when it comes to financial issues, does include a good history of broadcast’s early days.)
From the beginning and with the objective of ensuring robust local reporting, there have been limits on ownership of multiple media businesses in the same market, ownership of broadcasting outlets by those with business stakes in other industries and on the total number of radio or TV licenses one entity could own. Radio ownership was initially capped at 12 station licenses.
While the FCC variously added and deleted policies, the first real overhaul of broadcast regulations came with the Telecommunications Act of 1996, which promised outcomes including “more competition, more diversity, lower prices, more jobs and a booming economy.” For radio, the Act eliminated the national cap on station ownership and introduced a formula for the number of stations a company could own in any one market — the greater the number of total stations, the more stations that could be under one owner, within limits.
Television group owners were also able to increase their reach. The national audience cap was raised from 25% to 35%; today’s 39% came a few years later. Additionally, to compensate for the disadvantage of broadcasting on an analog UHF frequency (chs. 13 and higher), their audiences were counted as being half of those reached via VHF — the UHF discount.
The industry’s response to the regulatory changes was swift. Radio, which saw the greatest relaxation in ownership regulations, experienced the most immediate change. Soon after the Act was effective, Washington Monthly author Lydia Polgreen wrote: “In 1996 alone, 2,045 radio stations were sold, for a total of $13.6 billion.” She went on to say that by 1999, one owner controlled three or more stations in about half of all markets.
The result, as any radio aficionado will tell you, has not benefited listeners. There is an entire Wikipedia article titled “Radio homogenization” that discusses what its authors see as the 1996 Act’s negative effects on radio. The piece references a report from the Future of Media Coalition (FMC), which found less competition, fewer viewpoints and decreased program variety after the regulations were enacted. Under the subhead “Musical diversity,” the authors explain the FMC report shows that, despite what looked like an increase in the number of different formats offered between 1996 and 2000, the actual playlists tended to be similar. FMC calculated overlaps of up to 76% among the lists of songs for the various plans.
Does radio’s reality following the removal of national ownership caps have anything to teach us about what could happen if television caps are further relaxed or eliminated?
A look at what happened in television following the 1996 Act seems to indicate that it does. Some station ownership groups have reached the 39% ownership cap. Those groups would exceed the limit if the UHF discount, now considered to be obsolete following the switch to digital broadcasting (which favors UHF channels), were to be eliminated.
A television localism initiative, begun in the early 2000s, never really gained traction. In fact, in 2017, the FCC repealed the main studio rule, which was intended to encourage input from the public and keep stations involved in the community. Localism came up again in 2024, when the FCC, led by its Democratic chair, Jessica Rosenworcel, adopted the “Priority Application Review for Broadcast Stations that Provide Local Journalism or Other Locally Originated Programming.”
Given that both of the dissenting statements came from Republican commissioners, one of whom is now FCC Chairman Carr, it is unlikely that this policy will do much to encourage local program production. Some of the largest television group owners, including Sinclair, have already replaced local news production with a centralized news product, while others have simply cut the number of stories they cover. As happened with radio, increased consolidation of television station ownership appears to encourage less, not more, localism.
So, who benefits if the FCC further loosens television broadcast ownership rules? As the March 28 letter to Carr points out, local coverage is important:
Across the political spectrum, Americans trust their local news more than any other source. Broadcasters play an indispensable role in holding government accountable, fostering civic engagement and ensuring public safety awareness — often early on the scene in a crisis and last to leave.
If broadcasters do make a deal to get ownership rules relaxed, it will provide them a new opportunity to increase their ROI by decreasing overhead expenses. Television audiences across the country will benefit if station ownership groups commit a respectable portion of the increased return on what the 73 members of Congress who signed the letter to Carr say is the “the vital investment necessary to sustain and expand local coverage.”
Deciding to pursue profit above all else may well mean sacrificing the good of the whole for the benefit of a few. And if governments are not held accountable, our democracy itself could be at stake.